Urban Visualization: The Representation of a Neighborhood
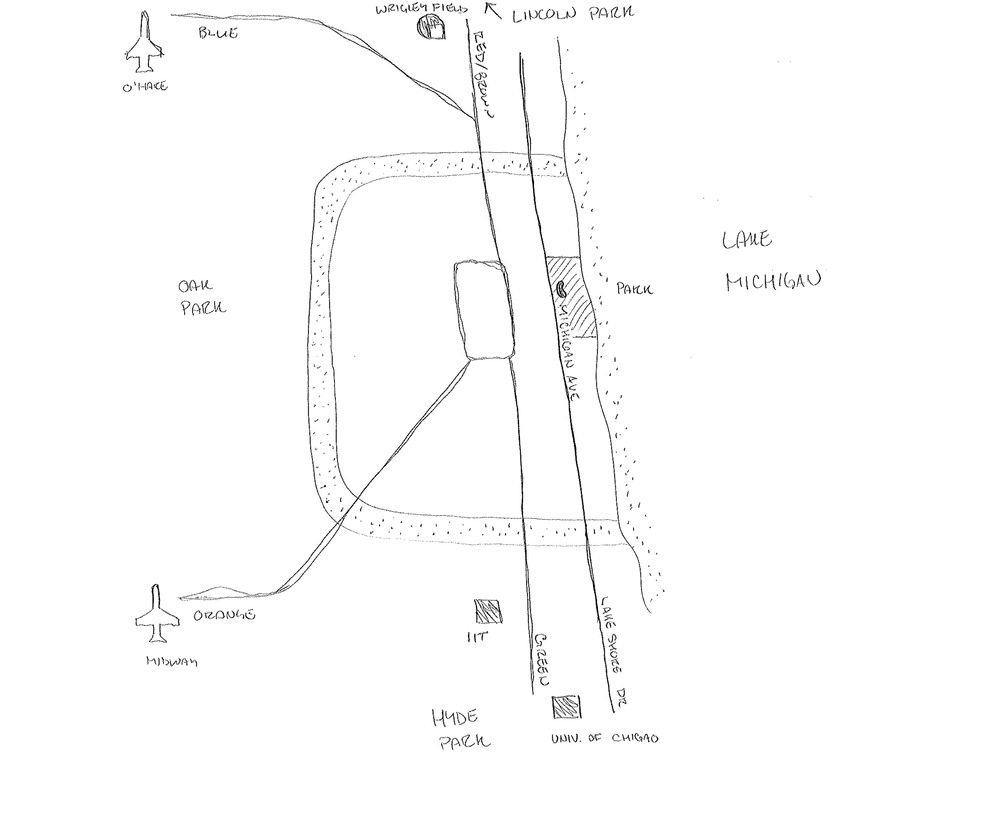
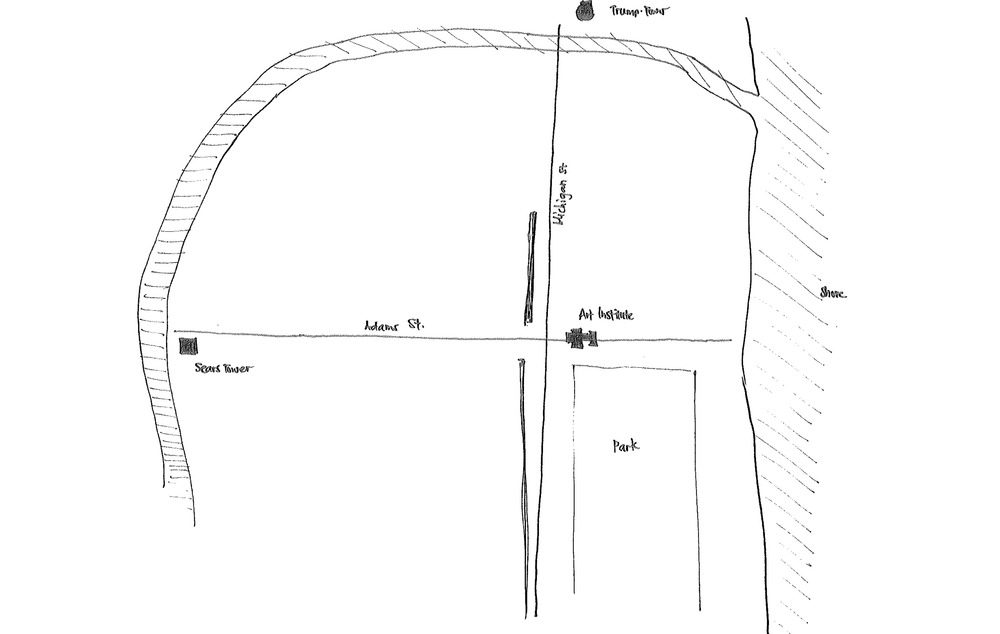
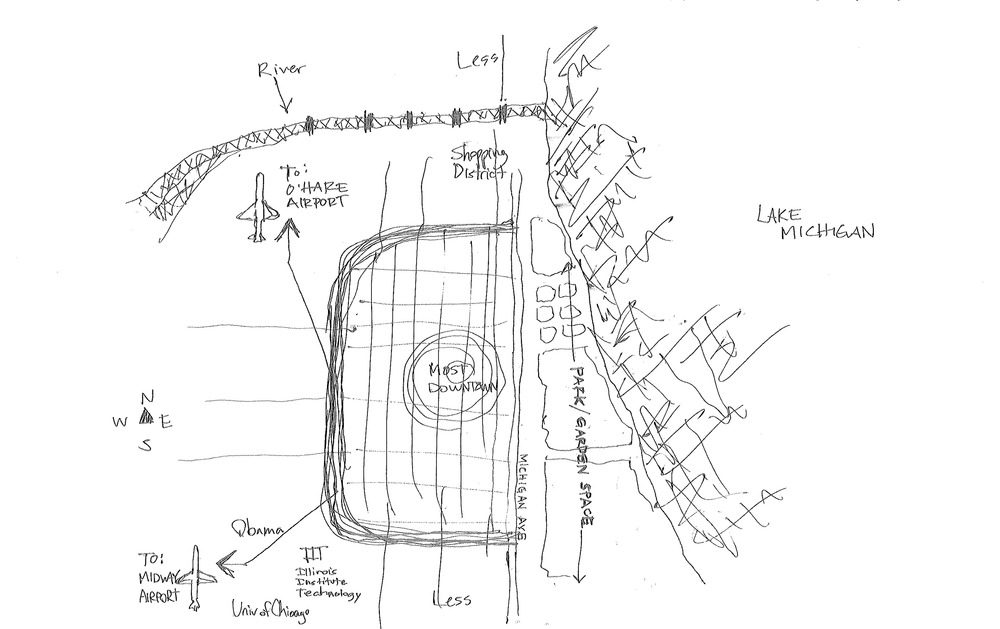
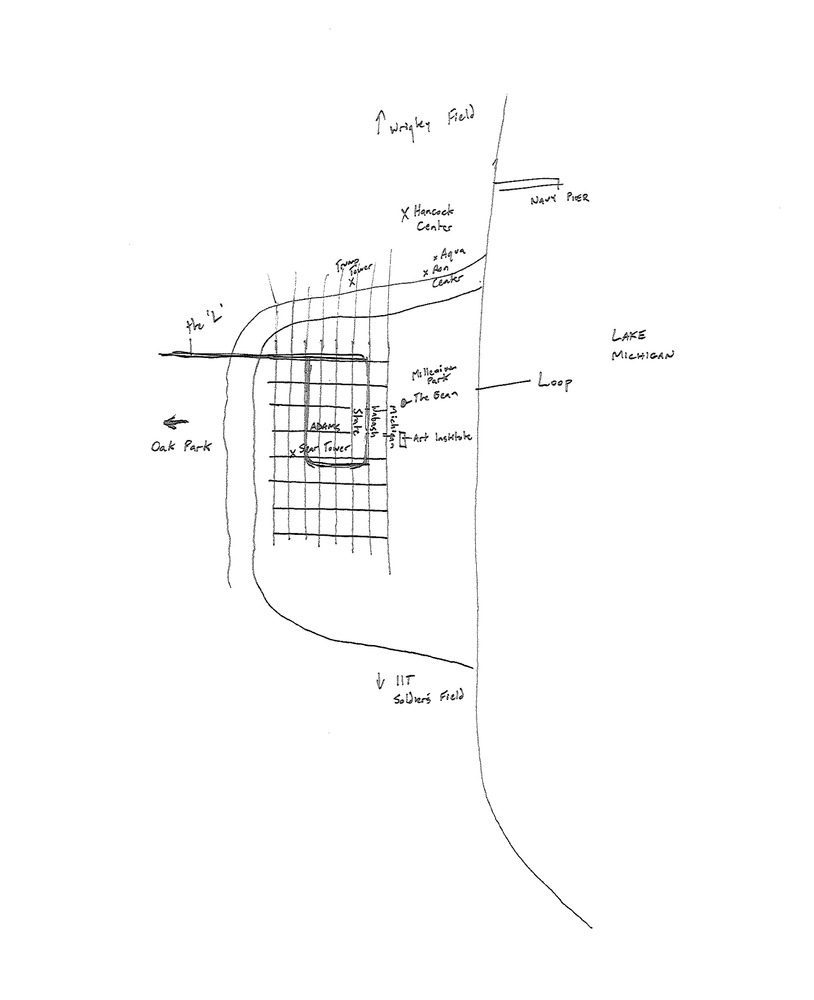
The urban visualization team has been analyzing sketch maps drawn by UNC Charlotte architecture students using three of Kevin Lynch’s five elements: segments, landmarks and neighborhoods. After recently doubling our sample size we are now recalculating the data to determine if correlations between the elements and other social factors (i.e. gender) still exist. One issue that has been raised regards the representation of neighborhoods. Is a grid of unlabeled segments as much a neighborhood as a clearly defined loop? The four images in the gallery show to two most common forms of neighborhood representation in the sample.
8.29.10